
Building a Real-Time ETL Pipeline with Kafka, PySpark, and Airflow
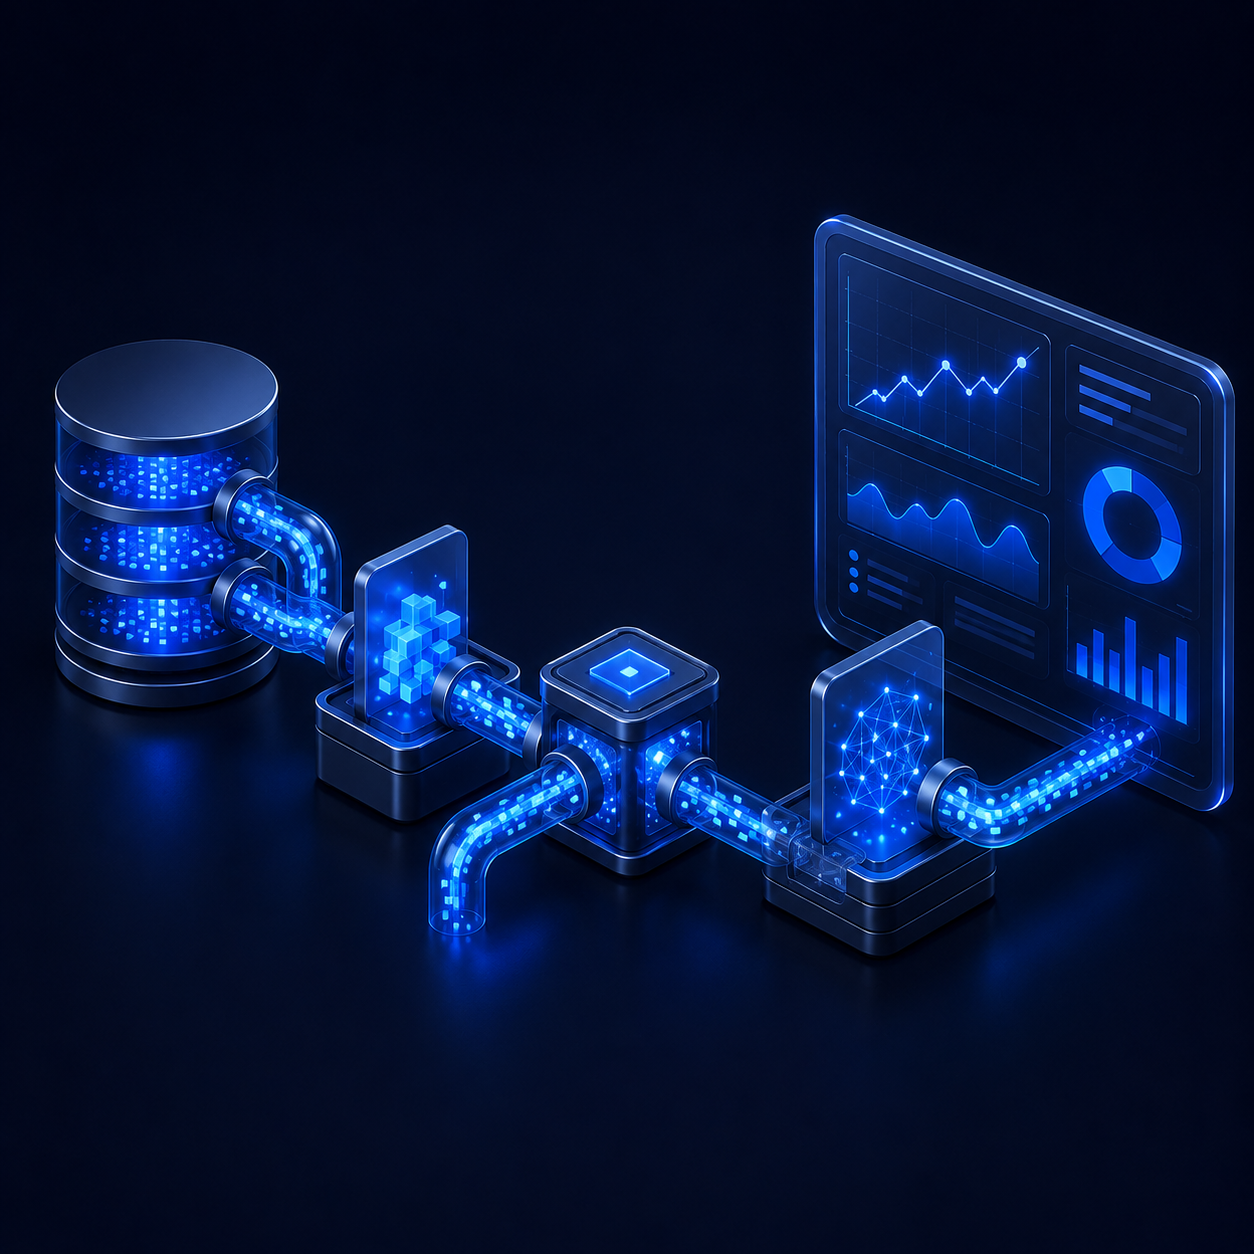
Batch pipelines that run overnight are fine, until the business needs to react now. When the cost of a late signal is measured in lost revenue or a missed incident, data has to move in real time. This is a walkthrough of a streaming ETL pipeline I built to do exactly that: ingest operational data, clean and score it on the fly, and land trustworthy metrics in a live dashboard.
Why streaming, not batch
A nightly batch job answers the question what happened yesterday? A streaming pipeline answers what is happening right now? For monitoring, anomaly detection, and operational KPIs, that difference is everything. The design goal was simple to state and hard to earn: a record produced at the source should appear, cleaned and checked for anomalies, in a dashboard seconds later.
The architecture
The pipeline is a chain of small, independent components, each doing one job well:
- Extractor — reads new records from the source database and publishes them to a message topic.
- Apache Kafka — the streaming backbone that decouples producers from consumers and absorbs bursts of load.
- PySpark transformer — consumes the stream, cleans and normalizes records, and computes KPIs.
- Anomaly detector — a scikit-learn model that flags outliers in the stream before they reach the dashboard.
- Loader — writes processed records into the destination store.
- Power BI connector — pushes results to live dashboards.
Keeping each stage isolated means any one of them can be scaled, replaced, or debugged without disturbing the rest.
Orchestration and observability
Apache Airflow orchestrates and schedules the tasks, so the pipeline’s dependencies are explicit and its runs are auditable. Prometheus scrapes metrics from every stage — throughput, lag, error rates — which turns is the pipeline healthy? from a guess into a dashboard. The whole stack is containerized with Docker Compose, so it comes up as one reproducible unit on any machine.
What I would tell anyone building one
Three things matter more than the framework choices. First, treat every stage as replaceable; loose coupling through a message bus is what lets the system evolve. Second, build monitoring in from day one, because a streaming pipeline you cannot observe is a liability, not an asset. Third, put data-quality checks inside the flow, not after it — catching a bad record early is far cheaper than explaining a wrong number later.